


Complete TSA⛏️ Manual

With all the useless “news”, contradictory guru-garbage, and squiggly lines that signify precisely nothing most of the time, some of you retail investors waste hours – hours! – staring at charts, getting emotional, and generally making a mess of your already modest capital.
I decided I have better things to contemplate than whether some dog-themed coin is hitting the moon or the sewer (Spoiler: It’s the latter)
So, I built a little tool. Something that digs through the mountains of market data like a truffle pig sniffing out diamonds. We call it The Stock Archeologist (TSA⛏️).

Forget your gut feelings and that influencer's "hot tip."

Every day, after those Wall Street charlatans close up shop, TSA⛏️ gets to work:
Scan: Chews through daily closing data for all the S&P 500 stocks.
Calculate: Runs a battery of indicators and complex signal checks. Does this stock show potential based on fine-tuned criteria?
Validate: If a signal pops up, TSA⛏️ doesn't just blindly flag it. It goes back in time – digs into the past (like an archeologist, hence the name) – finding every similar setup. How did the stock perform after this signal historically? Signals only get through if their historical projections meet strict performance thresholds.
Project: Based on that historical digging, it generates a probable future price range - a Forecast.
Contextualize: You get a clear chart showing the signal, the projection, and vital context: Is the overall market bullish or bearish? How's the stock's seasonality? Are earnings approaching (a potential landmine)? What's the fundamental Caesar Score? Is the stock defying the market? It even calculates a Confidence Score based on all these factors, telling you how much weight I might give the signal.
Share: All the signals that have passed all those tests are shared on our Telegram channel for your viewing pleasure.
Track: It also displays the performance of each of the signals to keep me honest.

I built TSA⛏️ for myself... and for Rick over at NASDUCK. I value my time and my capital far too much to rely on guesswork. This system brings discipline, historical perspective, and ruthless filtering to the table. It focuses on statistically relevant patterns. It stacks the odds. You get a clear, concise, data-backed perspective that is light-years ahead of whatever tea-leaf reading you're currently attempting. And you get to see how it fared.
The Signals
The program flags several distinct situations – signals. Don't get bogged down in the exact math; that's my job. Understand the gist of what the program looks for to interpret the output intelligently.

New Entry Setup
This signal acts as our system’s "watch list" trigger. It identifies a stock that has recently met our core health standards and has demonstrated consistently positive momentum over the last several trading sessions. It essentially tells our team that a stock is behaving correctly and is primed for a potential entry, even if the perfect moment to buy hasn't arrived yet.
The value of the "New Entry Setup" is in its preparation. The market can move quickly, and this signal allows us to do our deep-dive analysis and get ready to act before a major move begins. It filters the entire market down to a handful of promising candidates, allowing us to focus our attention and capital on the most deserving opportunities.

Green Candle Entry
This is our primary timing signal for executing a trade. After a "New Entry Setup" has put a stock on our radar, this signal patiently waits for the first day that the stock’s price closes higher than it opened (a "green candle"). This action serves as the final, crucial confirmation that buying pressure has officially taken control for the session.
Timing is a critical component of successful trading. This signal is valuable because it prevents us from entering a position too early, while a stock may still be wavering. By waiting for this definitive sign of buying momentum, we significantly increase the probability of entering a trade just as the price begins its upward move, which is key to maximizing returns.

Exceptional Strength
This signal identifies a stock whose momentum, as measured by our proprietary score, is in the top 5% of all its historical readings. In other words, the stock is demonstrating more powerful upward force than it has 95% of the time in its history.
This signal is invaluable for spotting the true leaders in the market. A stock exhibiting this level of exceptional strength is often in the midst of a powerful, headline-grabbing uptrend that can persist for some time. It helps us differentiate between stocks that are performing "well" and those that are truly dominant, allowing us to ride the strongest trends.

Early Warning
This signal flags a stock at the earliest indication that its character might be changing for the better. It triggers when our internal momentum score turns positive and the stock's short-term trend has just crossed above its long-term trend. It often appears before a stock has generated the momentum needed for our higher-conviction signals.
The "Early Warning" signal acts like a scout, identifying potential opportunities on the horizon before they become obvious to the general market. Its value is in giving us a head start. It allows our team to begin a deeper analysis on a promising stock early, positioning us to be ahead of the curve if the nascent trend develops into a powerful, sustained move.

Pivot Breakout
This is a classic technical signal that indicates a significant shift in strength. It triggers when a stock's price decisively closes above a key short-term resistance level that is calculated from the previous day's trading activity. To be considered valid, this "breakout" must be accompanied by a surge in trading volume.
A price breaking through a key resistance level is like a river breaking through a dam; it suggests that the force of buyers has finally overwhelmed the sellers. The volume confirmation ensures this is a genuine, powerful move and not a false alarm. This gives us confidence that the stock has a clearer path to move higher.

Multi-Factor Buy
This is our high-conviction confirmation signal. It only appears when a stock is exhibiting positive momentum, its short-term trend is stronger than its long-term trend, and it simultaneously passes a series of our core health checks, such as robust trading volume and a stable price. It’s the equivalent of all the dashboard lights turning green at once.
This signal is valuable because it’s not based on a single condition but on a confluence of positive factors. By requiring multiple, independent criteria to be met, we filter out noise and ambiguity. When the "Multi-Factor Buy" signal appears, it gives us significant confidence that a potential upward move is not just a fleeting spike but is well-supported by underlying market dynamics.

Pattern Match
This is one of our more advanced, AI-driven signals. It first identifies a specific "initiator" pattern, such as several consecutive days of rising prices. It then searches that stock's entire history for every other time the exact same pattern occurred and analyzes the technical characteristics of those past events. If the current situation's characteristics match that historical winning profile, the signal triggers.
The value of this signal is that it goes beyond generic indicators and learns from the stock's own unique history. It’s like having an analyst who has studied thousands of charts to say, "I've seen this company in this exact situation before, and it has historically led to a positive outcome." This provides a highly tailored, data-driven edge.

Reversal + Volume
This signal is specifically designed to identify potential turnaround opportunities. It looks for a stock that has been in a clear downtrend and then suddenly reverses to close higher for the day. Crucially, this reversal must happen on a significant spike in trading volume.
A sharp price reversal on high volume often marks a point of capitulation, where sellers are finally exhausted and a new wave of confident buyers has stepped in with force. This signal's value is in helping us spot a potential bottom in a stock, allowing for an entry at a very attractive price just as a new uptrend may be starting.

Fast MACD + Volume
This signal is optimized for our shorter-term trading charts, where speed and sensitivity are paramount. It uses a fast version of a classic trend-following indicator (MACD) to spot a fresh shift in positive momentum. This must be confirmed by a simultaneous surge in trading volume and an existing overall uptrend.
In fast-moving markets, timing is everything. This signal adds value by helping us quickly identify and act on low-risk entry points within a trend that is already established. It allows us to find opportunities to "buy the dip" in a strong stock, improving our timing and potential return.

Bullish Candle Pattern
This signal automates the detection of classic, visually recognizable bullish patterns made by the price "candles" on a chart, such as a "Hammer" or a "Morning Star" pattern. For this signal to trigger, the pattern must occur during an existing uptrend and be confirmed by a simultaneous increase in trading volume.
These visual patterns are reflections of market psychology and have been used by traders for centuries to gauge shifts in sentiment from bearish to bullish. By automating their detection and layering on our own strict trend and volume filters, we can confirm that the pattern is a genuine sign of strengthening buyer conviction.

Low Vol Breakout
This signal identifies stocks that have been trading in an unusually quiet and narrow price range, a condition technicians call a "squeeze." The signal triggers at the exact moment the stock price breaks out upwards from this quiet range, confirmed by a burst of trading volume.
Periods of low volatility and quiet trading are often the prelude to periods of high volatility and large price moves. The value of this signal is its ability to get us into a trade at the very beginning of a potentially explosive move, as the stock transitions from a "coiling" spring to an "unleashing" of energy.

Weekly Bounce Play
This is a contrarian signal that hunts for opportunities in stocks that the market has recently punished. It specifically identifies stocks that have been among the biggest losers over the past week but where the drop was not caused by a poor earnings report.
Sometimes the market overreacts, pushing a good company's stock down too far, too fast. This signal's value is in finding these temporarily oversold stocks that may be due for a sharp "snap-back" rally. It's a calculated, higher-risk strategy that aims to profit from short-term market inefficiencies and overreactions.

Price-Strength Divergence
This is a sophisticated signal that can often anticipate a trend reversal. It triggers when a stock's price chart shows it has just fallen to a new low, but our underlying momentum indicator fails to make a new low. This disagreement, or "divergence," is a powerful clue that the selling pressure is weakening.
The value of this signal is its predictive power. While the price action may still look weak to the naked eye, the divergence tells us that the "force" behind the selling is fading. It gives us an opportunity to get in near the bottom of a move, just before the trend potentially reverses from down to up.
Enhancement

For each stock flagged by one of our signals, there is an additional customized check that enhances the projection.
Think of it like a specialist with a slightly different toolkit offering a second opinion on the same finding. It's TSA⛏️ running with a different configuration – unique parameters designed to be more flexible and adaptive. Crucially, it doesn't scan the market independently; it runs only on tickers already identified by our signals.

Robustness Check: Similar projections from both modes add confidence that the signal isn't a fluke of one specific parameter set.
Sensitivity Analysis: Wildly different projections indicate high sensitivity to criteria – crucial for risk management.
Revealing Nuance: Different weighting might highlight potential outcomes the more rigid signal smoothed over.

Looser Similarity Criteria: Considers historical candles a "match" even if not identical. Accepts "mostly the same."
Different Indicator Emphasis: Temporarily places more importance on certain indicators (e.g., volume spikes, RSI extremes).
Adaptive Search: Can automatically widen search parameters slightly if initial matches are scarce, ensuring some relevant historical comparison.
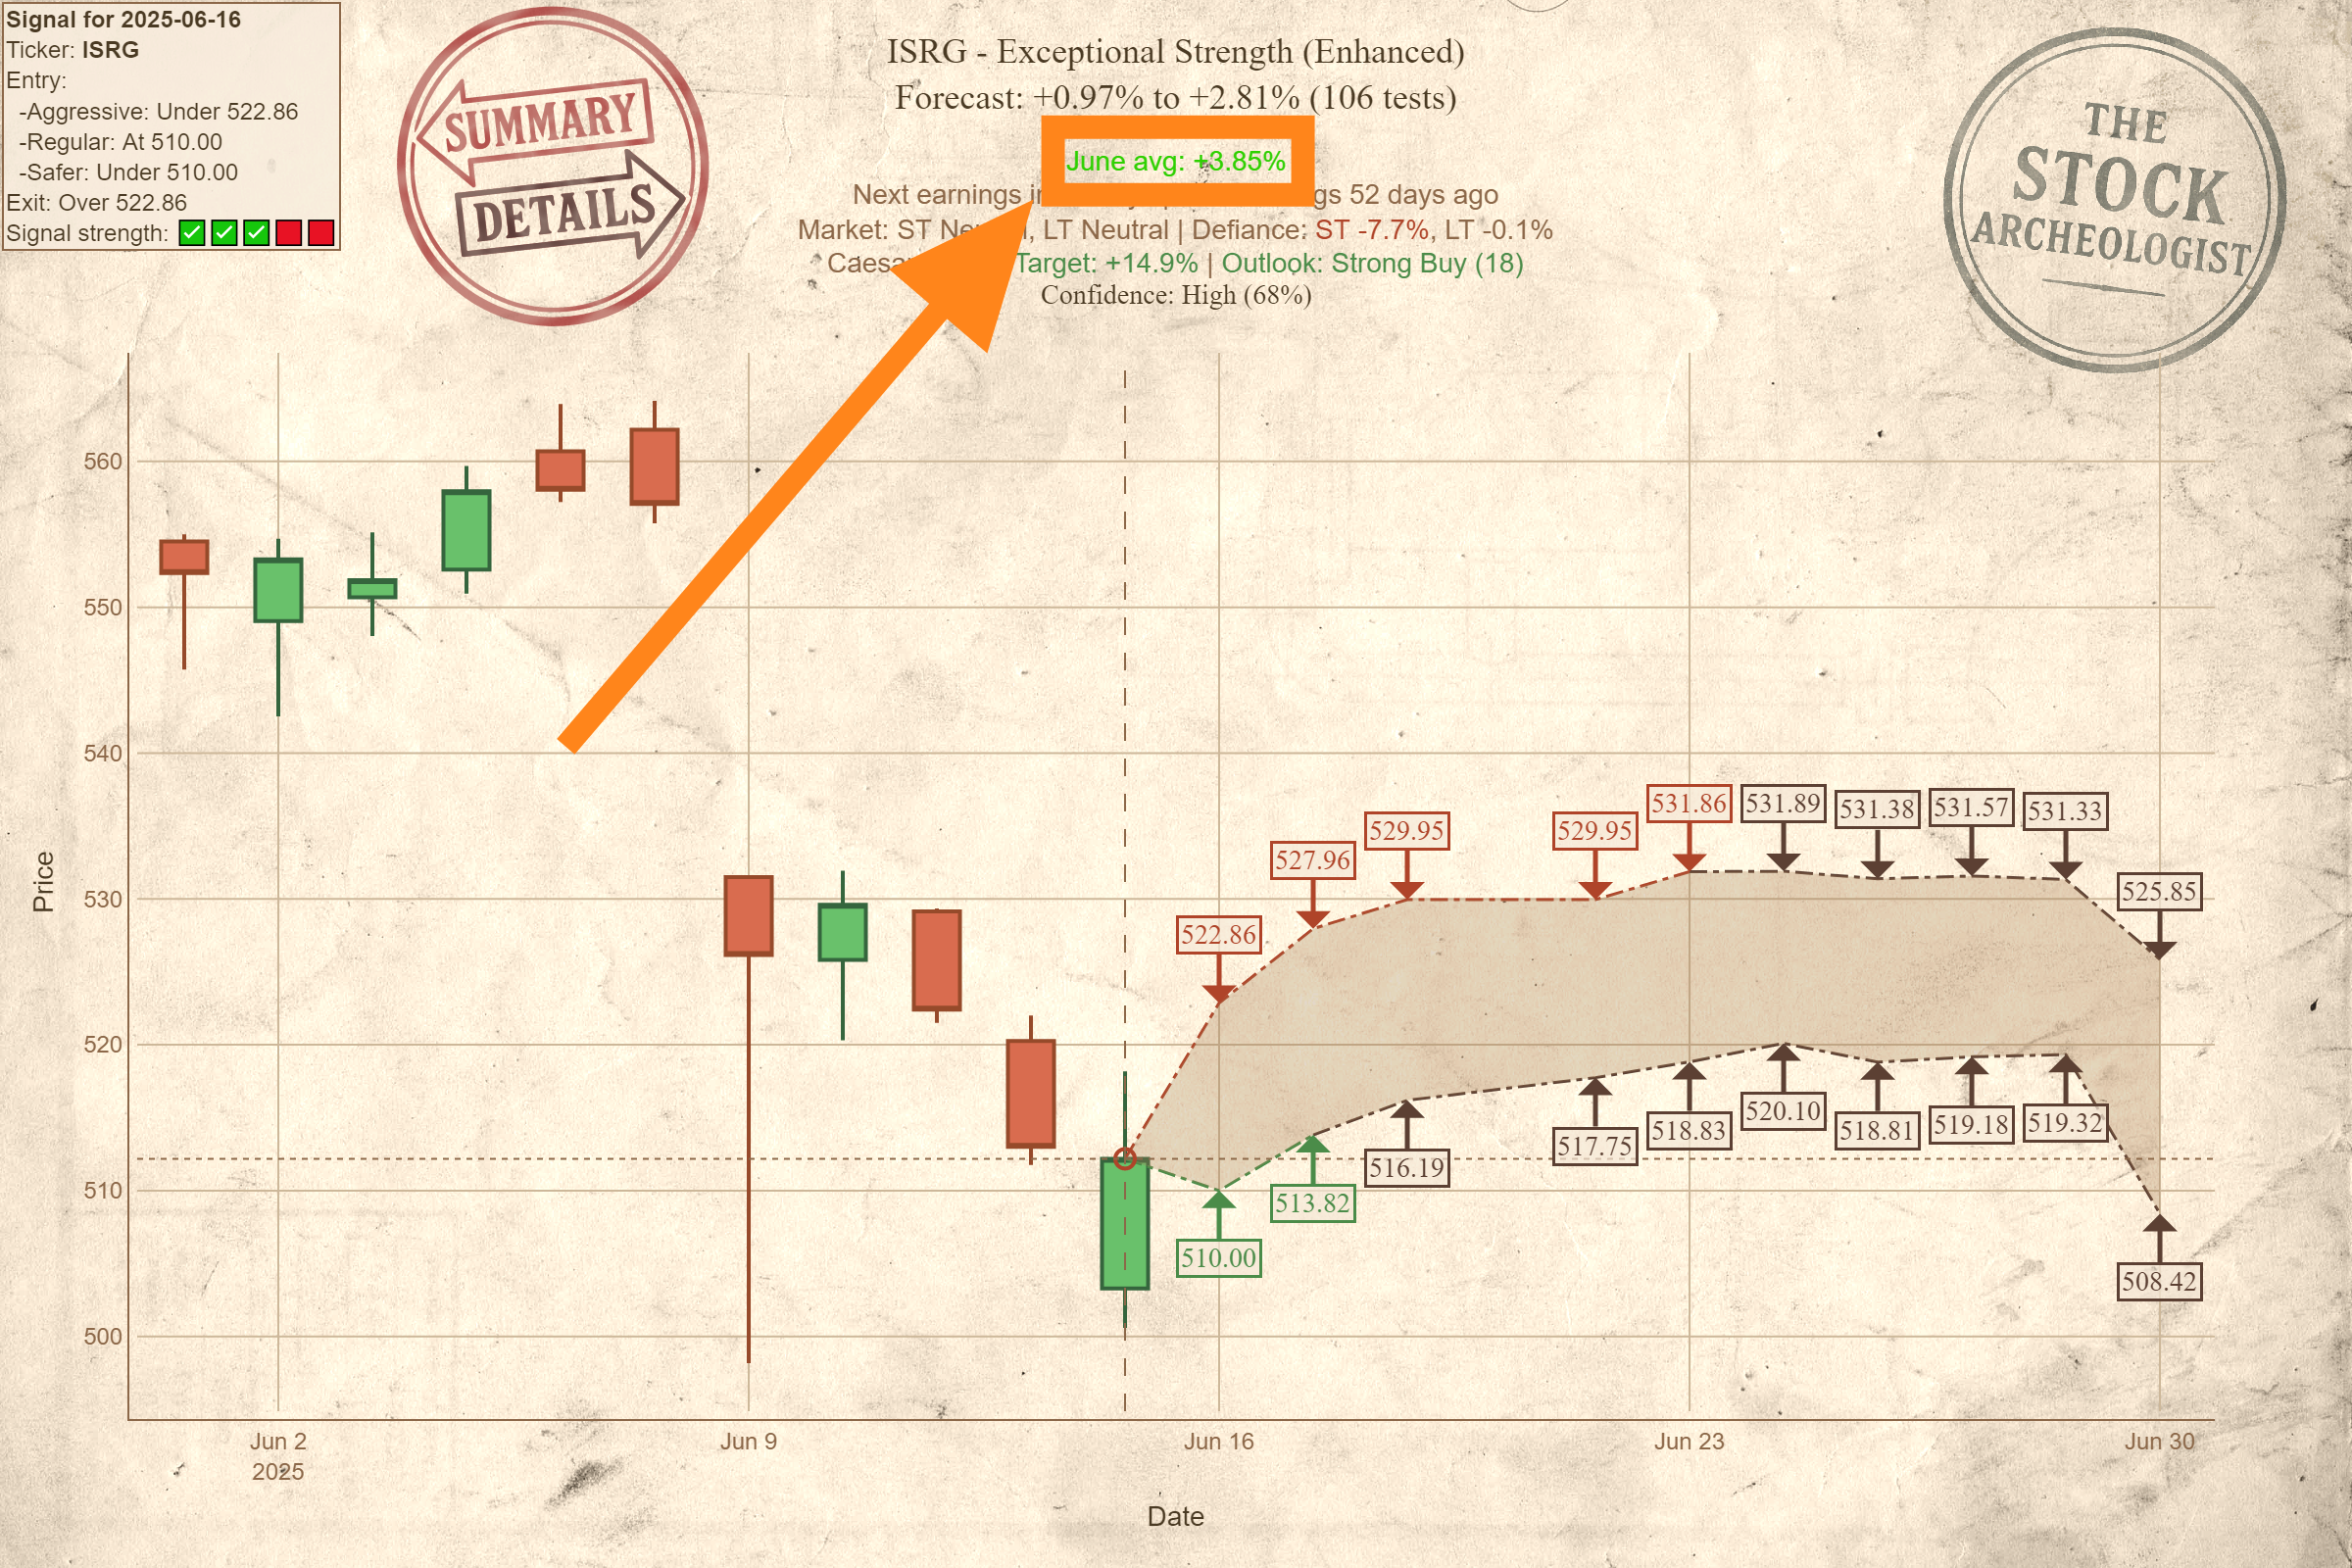
Forecast Chart Guide
Projected Range (Forecast)

When TSA⛏️ flags a signal, it digs through that stock's history for past instances of the same signal. For each signal, it tracks performance over the next 10 trading days (standard look-ahead). The Projected Range shows the average highest and average lowest point reached during those follow-up periods, relative to the signal trigger price. It's displayed as percentages.


The Signal Itself: Different signals have different historical track records (e.g., reversal signals might show sharper moves).
The Stock's History: Volatile stocks naturally have wider ranges than stable ones. Reflects typical behavior post-signal.
The Number of Tests (Critical): The range is an average. 50 historical instances are more meaningful than 5. Low test count = statistically weak range. Treat it like rumor, not a map. My system has minimum thresholds.

It's NOT a Prediction: It's a statistical average of past outcomes. Actual price will often go outside this range. Don't treat as absolute ceilings/floors.
Use for Risk/Reward Context: Does the average potential high justify the average potential low for this signal/stock historically?
Check the Test Count: Seriously. Low count (under 10-15)? Speculative. High count (30+)? Lends credibility.
Gauge the Width: Tight range (+5% to +2%) suggests consistency. Wide range (+15% to -5%) suggests significant outcome variation.
Combine with Other Info: Does the range align with market state, seasonality, earnings data? A strong projection in a hostile market is less compelling.
The Projected Range heavily influences the Confidence Score.
Seasonality

Seasonality is the observed tendency for a stock (or market) to perform better or worse during certain times of the year (usually monthly). Think retail pre-holidays, construction lagging in winter. Sometimes obvious, sometimes not.

Data Grab: TSA⛏️ Pulls long-term monthly historical price data (e.g., up to 20 years), focusing more heavily on recent history.
Crunching Numbers: Calculates percentage change for each month, year after year.
Weighted Averages: Clever bit: Gives more weight to performance in more recent years. Last May matters more than 15 Mays ago.
Minimum Data: Flags results as less reliable or ignores them if insufficient history exists for a month (needs ~5+ years).
The Output: Provides two key pieces:
Average weighted percentage performance for the current month (and next, if projection window crosses over).
Performance score/rank (1-12) showing how that month typically stacks up against others for that stock, historically.

Context. Seasonality is NOT a primary trading signal. Do NOT trade based purely on it. However, it provides potentially useful context:
Tailwind/Headwind: A buy signal entering a historically strong month? Slight positive factor. Entering the worst month? Be more cautious. Marginal edges.
Filtering Noise: Stock moving counter to seasonal patterns? Might indicate underlying strength/weakness overriding history.
Avoiding Faceplants: Stock historically hammered every October? Maybe don't go all-in long on Sept 30th without very strong confirming signals.
This factor contributes lightly to the Confidence Score.
Earnings Proximity

This isn't decoration; it's critical context. Ignoring it is flying blind. The program looks up:
Days Until Next Earnings: Trading days before the next scheduled quarterly report.
Days Since Last Earnings: Trading days since the last report.


Earnings reports = volatility events. Period. Companies drop news, stocks react, often violently (gap up/down). The market's reaction often matters more than the pre-earnings technical setup. Trading right before earnings is gambling on the outcome. Trading right after can be choppy.
An impending earnings report throws a massive fundamental wrench into predictable technical patterns. Because earnings introduce significant, unpredictable risk, the program penalizes proximity in the Confidence Score:
Getting Closer to Earnings: Fewer days until = lower confidence. Risk ramps up significantly in the final 10-15 days.
Just After Earnings: Immediate aftermath (first ~5 days) is often chaotic. Signals here also get confidence slightly reduced (less severely than pre-earnings).
Think of it as a risk adjustment. A technically perfect setup carries more uncertainty five days before earnings than 50 days before. The Confidence Score reflects this.
Market State

A signal doesn't exist in a vacuum. Trading signals without context is how amateurs blow up accounts. Market State is the prevailing wind – are you sailing with it or fighting it?


Think of the market as the tide. A great individual stock setup (a signal) is a speedboat. Rising tide (bull market)? Speedboat flies. Falling tide (bear market)? Even the best speedboat struggles. Ignoring the market state ignores the dominant force acting on most stocks. It directly impacts probabilities. A bullish signal has a higher chance in a bull market. The same signal in a bear market? Odds are stacked against you. Understanding Market State helps filter signals, manage risk, and stay out when conditions are hostile.

No secret sauce, just systematic common sense using the SPY ETF as the market proxy. We look at SPY relative to two key Simple Moving Averages (SMAs):
Short-Term State: Based on the 50-day SMA (~2 months). Current trend.
Long-Term State: Based on the 200-day SMA (~10 months). Major trend.

The program calculates SPY's distance from these averages and assigns a state based on thresholds:
Bull: Significantly above SMA. Positive conditions. Tailwinds.
Bear: Significantly below SMA. Negative conditions. Headwinds.
Neutral (or Sideways): Close to SMA. Choppy conditions likely.
The output combines these (e.g., Short: Bull / Long: Bull). Interpretations:
Bull / Bull: Ideal. Strongest tailwind.
Bear / Bull: Pullback in uptrend. Caution, potential dip buy if signal strong, higher risk.
Bull / Bear: Rally in downtrend (bear market rally?). High risk for longs.
Bear / Bear: Double Bear. Maximum headwind. Bullish signals very low probability. Stay defensive.
Neutral combos: Indicate chop or transition. Extra care needed.

Market State significantly impacts the Confidence Score:
Alignment Boost: Bullish signal + Bullish Market State (esp. Double Bull) = significant confidence boost.
Conflict Penalty: Bullish signal + Bearish Market State (esp. Double Bear) = confidence penalized, often heavily.
Beta Consideration: High-beta stocks rallying in a bear market get penalized more than low-beta stocks. Realistic probabilities.

Check the Market State first. Double Bull? Best chance. Double Bear? Maybe sit out longs. Mixed? Be selective, prioritize high confidence, consider smaller size. Don't fight the tape unnecessarily. It’s fundamental risk management.
Market Defiance

Looking at a stock in isolation is amateur hour. Understand how it behaves relative to the broader market. Is it leading, lagging, or doing its own thing? That's Market Defiance. Ignoring this is like navigating a minefield by looking only at your feet.


It measures how much a stock's performance deviates from the S&P 500 (SPY proxy). Not just raw percentage points – that's too simple. TSA⛏️ calculates two key versions:
Short-Term Defiance: Compares performance over ~last quarter (50 trading days).
Long-Term Defiance: Compares performance over ~last year (200 trading days).

Relative strength/weakness is powerful:
Finding Leaders: Strong positive defiance (esp. when market weak/flat) shows independent strength. Buyers actively choosing it.
Spotting Laggards: Negative defiance in a bull market is a red flag. Why isn't it participating?
Contextualizing Signals: Buy signal + strong positive defiance = more weight. Buy signal + negative defiance = needs scrutiny.

The algorithm (proprietary specifics aside) involves:
Baseline: SPY performance over relevant period (50/200-day).
Stock Performance: Stock's performance over the same period.
Beta Adjustment (Key): Adjusts expected stock performance based on its Beta (sensitivity to market moves). High-beta stocks should outperform in bull markets / underperform in bear. Low-beta moves less. Calculation accounts for this expected volatility. A high-beta stock needs to beat SPY by more to show positive defiance.
The Score: Actual performance minus beta-adjusted expected performance (as %). Positive = better than expected; Negative = worse.
Short-Term Defiance: Reflects recent momentum, sentiment shifts, news reactions. Useful for gauging immediate pressure.
Long-Term Defiance: Shows underlying relative strength/weakness trend. Often reflects deeper institutional views or fundamental shifts.

Market Defiance significantly impacts the Confidence Score:
Positive Defiance: Generally boosts confidence. Strong positive defiance (esp. long-term) in weak/neutral market gets strong positive weight (suggests resilience, demand).
Negative Defiance: Generally lowers confidence. Lagging stock, even with buy signal, viewed cautiously. Beta adjustment ensures fairness unless deviation from expectation is significant.

It’s a major factor, providing crucial context about the stock's relationship with the herd. Check Market State and Defiance numbers:
Example 1: Market: Bull/Bull | Defiance: ST +3.5%, LT +8.1% -> Strong stock in strong market, outperforming expectations. High confidence likely justified.
Example 2: Market: Bear/Neutral | Defiance: ST +2.1%, LT -1.5% -> Recent resilience against weak market, though longer trend meh. Positive ST defiance notable.
Example 3: Market: Bull/Bull | Defiance: ST -4.0%, LT -9.5% -> Market strong, stock lagging significantly. Buy signal confidence likely penalized. Caution.
Market Defiance distinguishes real strength from just riding the market wave.
Caesar Score

This is my proprietary fundamental analysis score, baked into TSA⛏️.
Think of it as a quick, potent measure of a company's multi-dimensional financial health and competitive moat. While signals analyze how a stock trades, the Caesar Score evaluates what you're trading. Solid business or financial vaporware? It crunches a vast array of fundamental data, distilling complex metrics into a single, actionable score.


A stock can have a beautiful chart right before disastrous earnings or revealing crippling debt. Technicals show market sentiment; fundamentals show underlying value. Ignoring fundamentals is inviting disaster. The Caesar Score is the crucial quality filter that saves you the god-awful tedious task of manual financial vetting. Time is money. My score saves you time.

The exact formula is secret sauce, but v4 is a major leap forward. It's lifecycle-aware, meaning it judges a high-growth tech company by different standards than a mature utility. It assesses multiple dimensions:
Profitability & Free Cash Flow: Is profit backed by real cash (Operating Cash Flow vs. Net Income)? Is the company generating Free Cash Flow (FCF) that can be used for growth, dividends, or buybacks?
Quality & Moat: Does the company have a competitive advantage? We assess Quality of Earnings (are profits consistent or based on accounting tricks?) and Economic Moat (is Return on Invested Capital (ROIC) high and stable? Are gross margins strong?).
Financial Stability & Risk: How much debt is on the books (Debt-to-Equity vs. sector peers)? Can it cover its interest payments? New in v4, we also assess Volatility/Risk by analyzing the stock's Beta, penalizing overly risky stocks.
Growth & Forward Look: Is revenue growing? Crucially, v4 is forward-looking, incorporating analyst estimates for future earnings and revenue growth to see if the outlook supports the current price.
Dynamic Benchmarking: Factors are normalized against dynamic sector data. Comparing Apple's R&D to a utility's is pointless. The score intelligently benchmarks a company against its true peers.
Valuation Penalty: The score penalizes companies with excessively high Price-to-Earnings (P/E) ratios relative to their sector, preventing you from overpaying for quality.
The Caesar Score is a major input into the Confidence Score:
Score Interpretation (v4 Scale)
The v4 scale is stricter and more demanding:
< 0: Severe Distress 🟥⚠️
0-5: Poor 🟥
5-10: Moderate 🟨
10-15: Good 🟩
15-20: Excellent 🟩🟩
> 20: Exceptional 🟩🟩🟩
The Caesar Score is a major input into the Confidence Score, providing the fundamental validation (or invalidation) for a technical setup. Ignore it at your peril.
Contextual Factor: Analyst Targets and Grades

Let's consider the spreadsheet jockeys. This is external data – opinion, consensus, sometimes herd mentality. Not raw TSA⛏️ signal generation, but ignoring it is naive. It moves markets, provides sanity checks, highlights disconnects. The program accounts for it, with perspective.


What it is: Average price where Wall Street analysts think a stock should trade (usually next 12 months). Consensus from multiple estimates.
Why track it? Quick read on perceived value (according to suits). Price below target? Potential upside seen. Price above? Seen as overvalued (or models lag). Sentiment gauge.
How it’s used: Calculates % difference between current close and consensus target.
Confidence Impact: Nudges confidence. Significant discount (e.g., 15%+) = positive bump. Significant premium (e.g., 10%+) = negative bump. Price near target = minimal impact. Contributing factor, weighted appropriately (less than core signals). Don't trade solely on this.

What it is: Overall sentiment boiled down: Strong Buy, Buy, Hold, Sell, Strong Sell. Aggregated from numerous analyst ratings.
Why track it? Quick sentiment snapshot. Strong "Buy" consensus? Broad institutional interest likely. "Sell" consensus? Potential headwinds. Reflects their collective view.
How used: Grabs latest consensus. Uses internal point system (Strong Buy = most positive, Strong Sell = most negative, Hold = slightly negative) mapped to the outlook category.
Confidence Impact: Strongly positive consensus = positive nudge. Strongly negative = negative nudge. Mixed/Hold heavy = minimal impact. Tells if swimming with/against analyst current. Factored in, doesn't drive the bus.

Analysts are often late. They react, follow trends. Sometimes right, sometimes miles off. TSA⛏️ focuses on price, volume, momentum – the market's footprint.
These metrics are valuable context. They frame TSA⛏️ signals. Bullish signal + strong analyst support + discounted target? More interesting. Bullish signal + "Sell" rating + exceeded target? More caution needed.
Use this data intelligently. Another layer in the dig, understanding the environment around the artifacts. Don't mistake map commentary for treasure. Focus on primary signals; use analyst data as supporting evidence or reason to dig deeper.
The Confidence Score: Synthesis

We've covered the signals TSA⛏️ looks for. Now, how much conviction does it assign? That's the Confidence Score: 0 to 100. Higher means more supporting factors align with the primary signal. It’s a weighted average of several elements, a quick gauge of the setup's overall strength beyond basic criteria. A multi-factor verification layer.


The score synthesizes data points providing context and confirmation (or contradiction). Influences, roughly by impact:
Projection Quality (Heavy Weight): Historical backtest performance for this signal on this stock. Consistent positive outcomes? Tight, positive-skewed projected range? Decent test count? Strong history boosts confidence significantly. Weak/sparse history lowers it.
Market Defiance (Heavy Weight): Stock moving with/against market (SPY), adjusted for Beta? Buy signal while market tanks shows relative strength = boost. Buy signal when market roaring = less impressive.
Market Context (High Weight): Overall market trend (Short/Long term SPY) bullish, bearish, neutral? Buy signal in strong bull market > score than in bear market. Penalizes signals fighting strong opposing tide.
Earnings Timing (High Weight): Earnings imminent or just passed? Proximity = volatility/unpredictability. Signals too close get confidence reduced. Prefers clean setups away from earnings noise.
Fundamentals (Caesar Score) (Medium Weight): Underlying company solid? My proprietary Caesar Score gives a quick read. Fundamentally sound company adds confidence to technical signal.
Analyst Consensus (Medium-Low Weight): Professionals' view? Consensus price target (discount = good) & overall rating (Buy/Hold/Sell) add texture. Secondary check.
Seasonality (Low Weight): Stock historically perform well this month (and next, if projection spills over)? Minor factor, more context than driver.

Not all signals are equal. A buy trigger might occur, but if the market's collapsing, earnings are tomorrow, and history looks shaky, you need that distilled context.
It helps you:
Filter: Quickly see signals with more supporting evidence.
Prioritize: Focus research time on higher-conviction setups.
Manage Risk: Lower score might warrant smaller size or tighter stop-loss.

Think of it as a probability gauge, not a guarantee.
Very High (80-100): Strong alignment. Multiple factors support. Worthy of serious attention.
High (60-79): Good alignment. Most factors positive. Solid setup, standard checks apply.
Medium (40-59): Mixed signals. Some support, others don't. Needs careful scrutiny. Understand why it's not higher.
Low (20-39): Weak alignment. Significant conflicting factors. Tread very carefully, likely needs strong independent justification.
Very Low (<20): Major red flags. Usually best to ignore unless you have a compelling, contrary reason.

The Confidence Score is critical for interpreting the output. It adds nuance, context, and risk assessment. Use it alongside the raw signal and projection chart. Don't trade blindly on any single number, but use the Confidence Score to rapidly assess the landscape.
Conclusion
You now have the essential framework for understanding The Stock Archeologist's output. This system provides disciplined, data-driven, historically validated, and context-aware analysis to cut through market noise. The rest is up to you – execution, further research, and rigorous risk management.
Time to get back to the real work.
Caesar