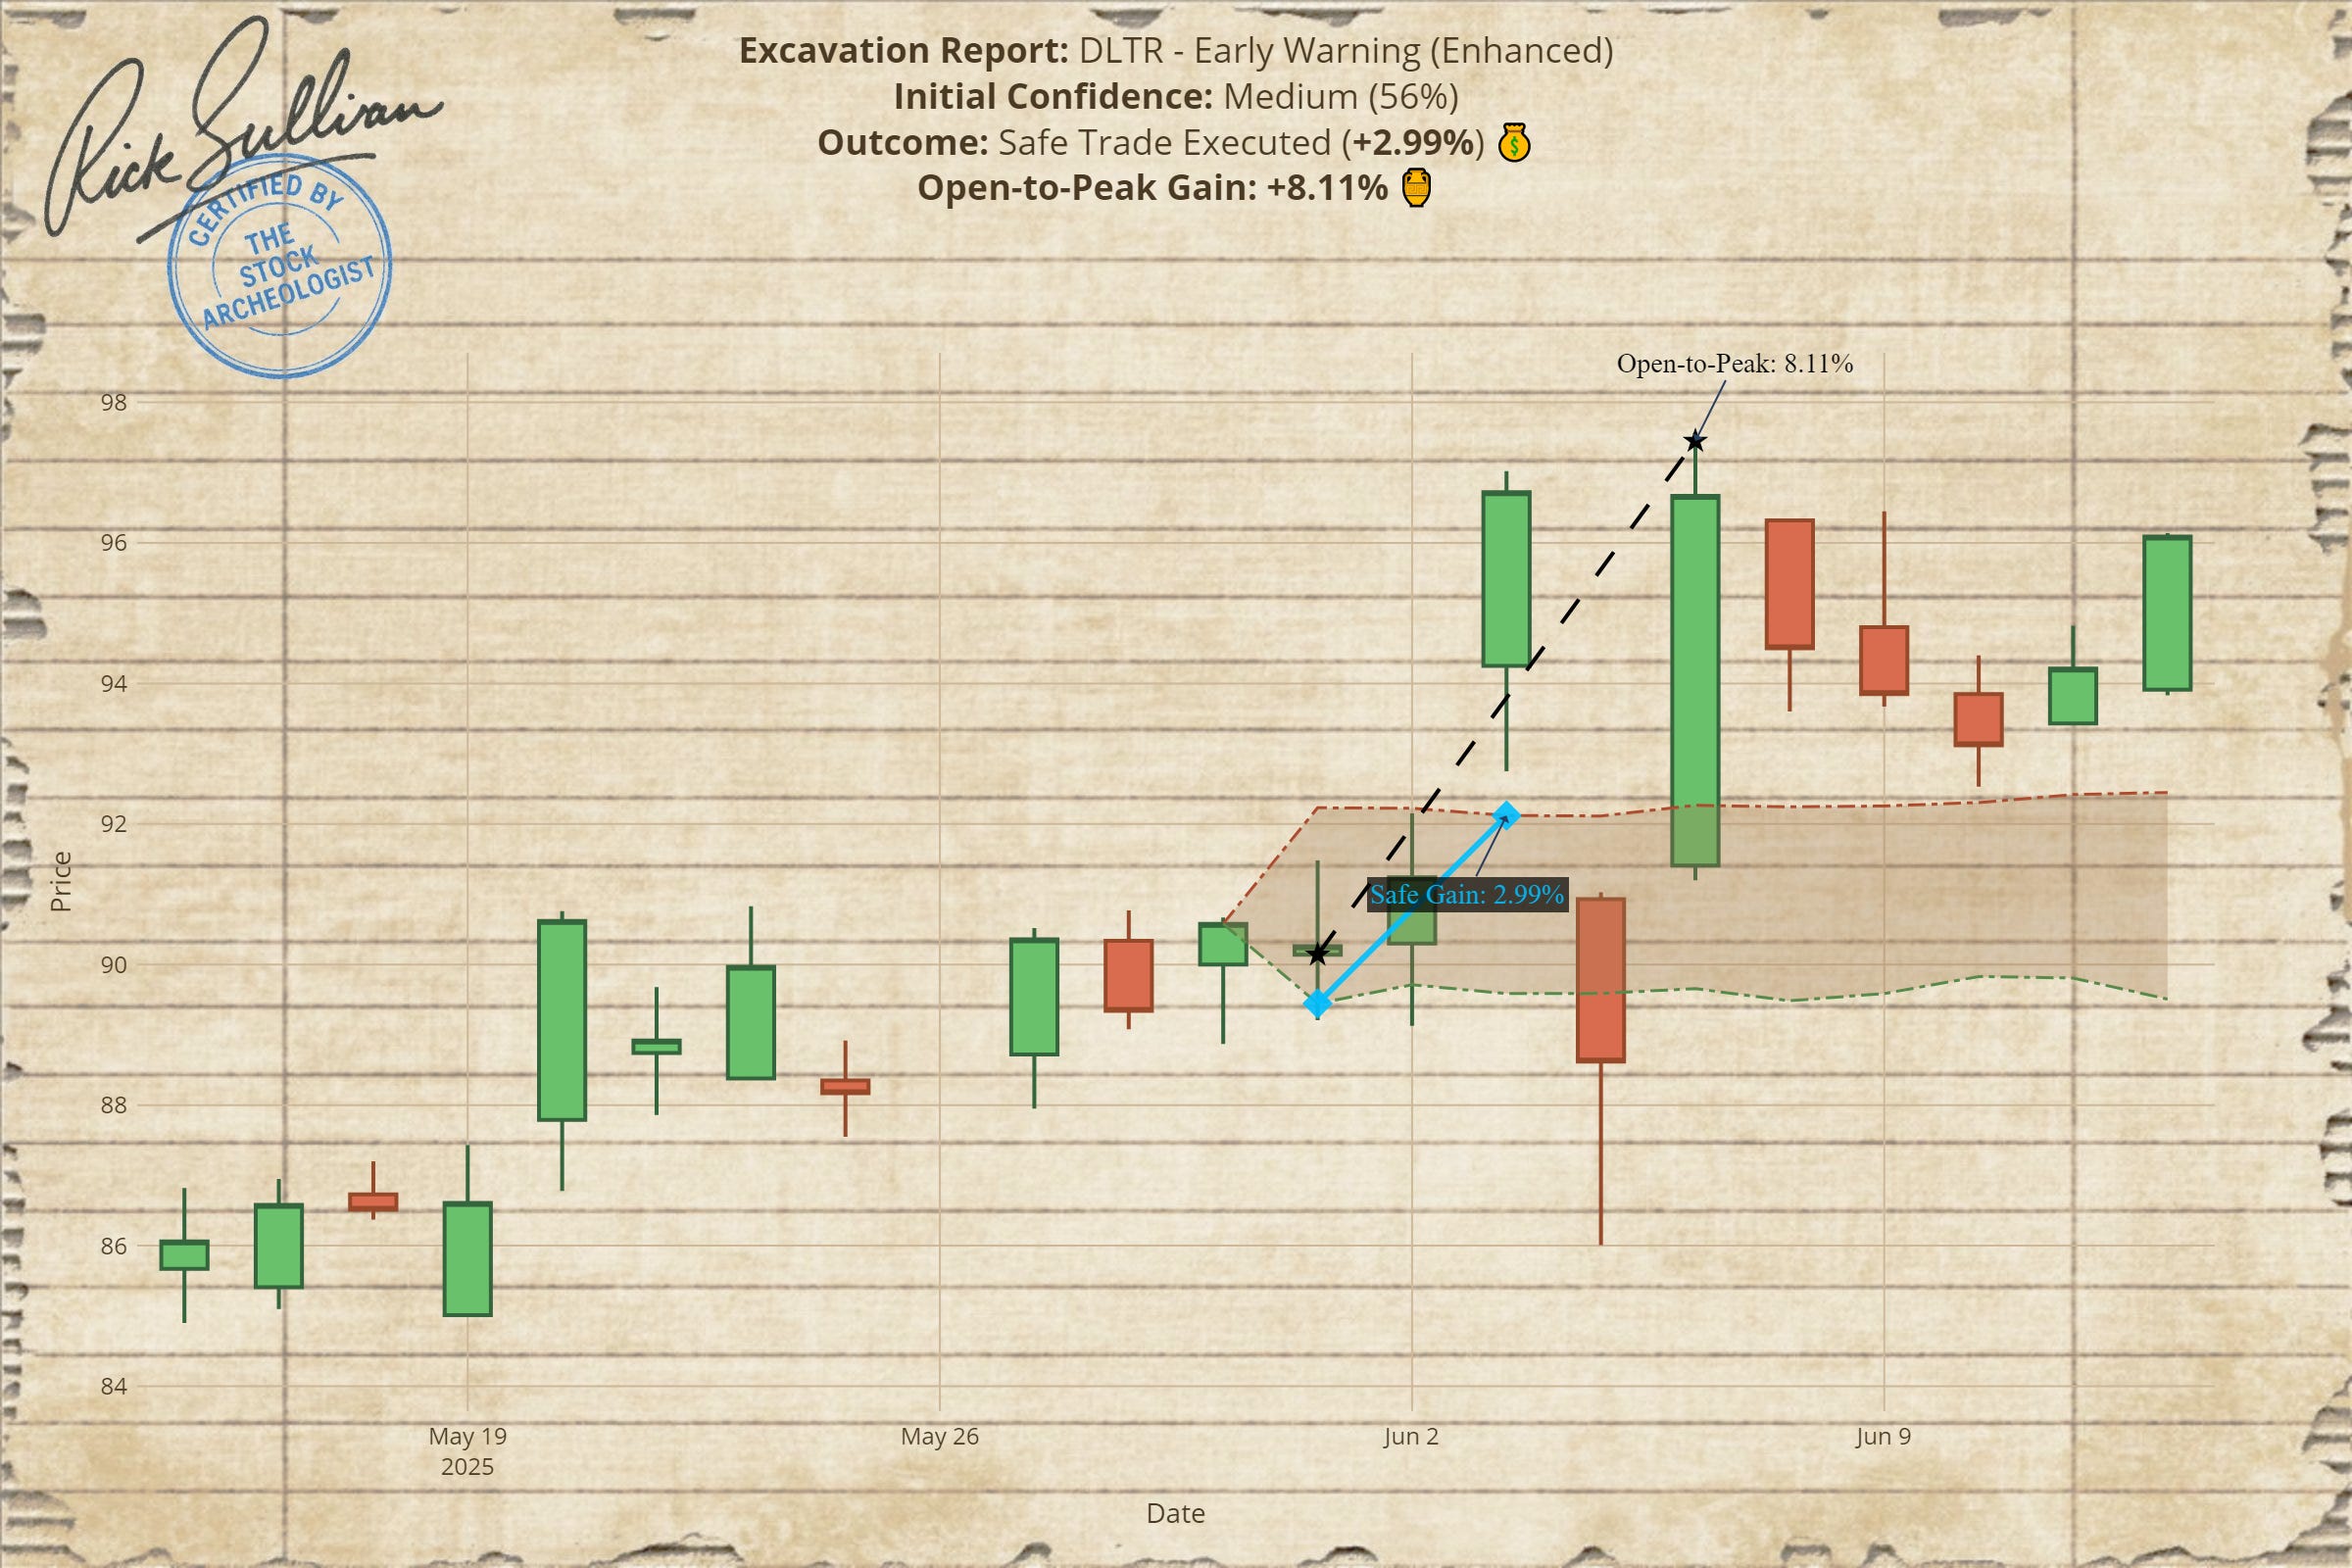
Been heads-down in the code cave for a bit. The market doesn't sleep, and neither does the system that hunts it. I've rolled out some major upgrades to the Stock Archeologist app.
One Chart to Rule Them All: The "Enhanced" Forecast
You might have noticed the charts look different. I've streamlined the analysis.
Before, you'd get two different charts for a stock – one based on my standard pattern analysis and another on a more niche historical similarity search. It was powerful, but potentially confusing.
Now, they're combined.
The system now intelligently blends both forecasts, weighting them by the number of historical tests each one has. The result is a single, smarter, more robust chart I’m calling the Enhanced Forecast.
To make things even faster for you, I've also added a Quick Summary box in the top-left corner of every chart. It gives you the key entry and exit price levels for the next trading day. All the key data, right where you need it. No more digging through the annotations.
The Caesar Score Gets Tougher
The Caesar Score – my fundamental health check on a company – has been upgraded to v4.
It's a lot smarter and a lot tougher. It now looks at a company’s entire lifecycle (is it a startup, a mature giant, or in decline?), its cash flow quality, and benchmarks it dynamically against its direct competitors in real-time.
The scoring is stricter. A high score means more than it ever has. A low score is a bigger red flag. Read more in the link below:
Weekly Performance Reports
I've built a new module for the Archeologist that I call the "Excavation Report."
It goes back and analyzes our signals from 10 days before against what actually happened in the market. It will show the wins, the losses, and the missed opportunities.
No one bats a thousand. Anyone who tells you they do is selling you something. This is about transparency. We'll post these reports weekly in both the paid and free channels so we all know exactly how the system is performing.
Free Demo Channel
For those of you on the fence, I'm opening up a free demo feed.
Subscribe for free to this Substack and you'll get access to a free Demo Telegram Channel.
In it, you'll get:
One signal per day from the full S&P 500 scan.
Daily performance reports from 10 days ago.
It's a no-risk way to see the tool in action.
If you find it useful, you can upgrade to the paid tier for all the daily signals.
Housekeeping
Finally, I’ll be updating the user manual and other posts on the main Substack page over the next few days. They'll have new screenshots and will reflect all these changes.
That's it for now. Back to the terminal.
Caesar


Sounds great. I'll be anxious to see the new reports.